How to Create 3D Surface Chart with Javascript
In this post I’m going to show you how to create a 3D surface chart with just JavaScript using Plotly.js. An open source JavaScript graphing library that is built on top of d3.js and very powerful for making graphs and charts. It is the same library that I have showed you how to create a real-time updating chart in previous tutorial.
Let’s check it out!
Setup
So as usual, if you’re not using npm we’ll download the latest release of Plotly.js from github and include it to your page using script tag and also create a div element that you want to display the chart.
<script src="plotly.min.js"></script>

<div id="chart"></div>
Create a Surface Chart
To create a surface chart, you will need to provide the data in array of arrays format like this one.
You can retrieve the data from 3rd API, read it from CSV file or from your database but eventually, you’ll need to convert it into array of array before passing to the library. So in the first example, I’m going to write a function to create an array of arrays with random data with the size of 10. And the second example, I’m going to read the data from CSV file.
Here is our function to create a random array value
function getData() {
         var arr = [];
         for(let i=0;i<10;i++)
             arr.push(Array(10).fill().map(() => Math.random()))
         return arr;
}
Now we’ll call Plotly.newPlot and pass the chart div element, follow by data and chart definition object. You can provide the data by passing the array into z property and set the type to surface
var data = getData();
Plotly.newPlot('chart', [{ //multiple traces
z: data,
type: 'surface'
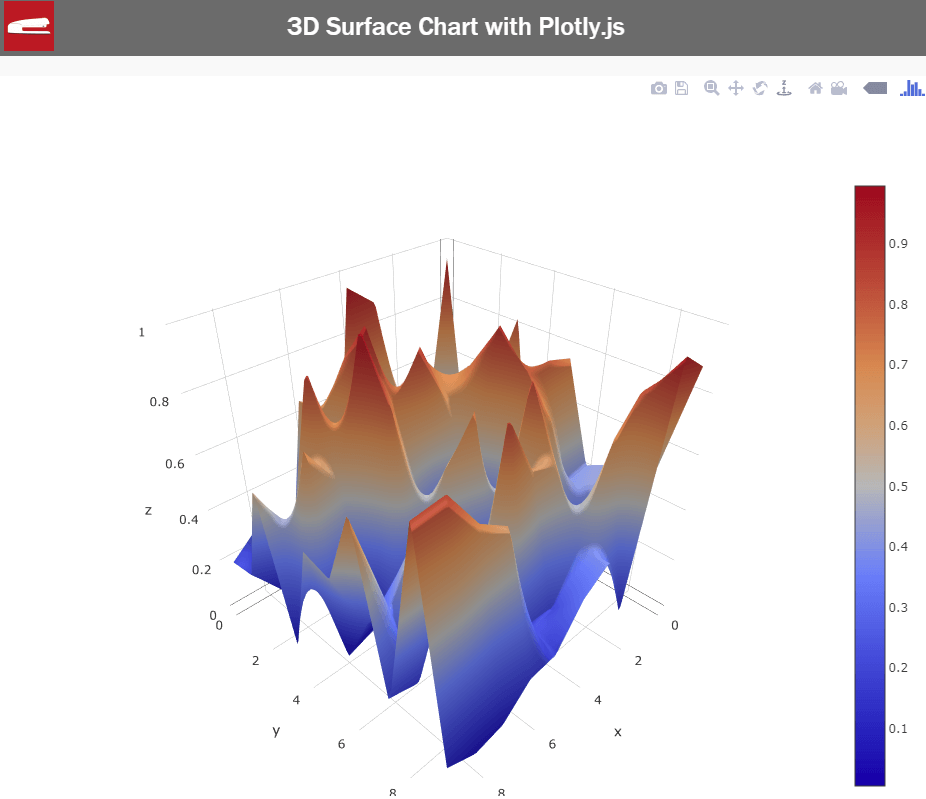
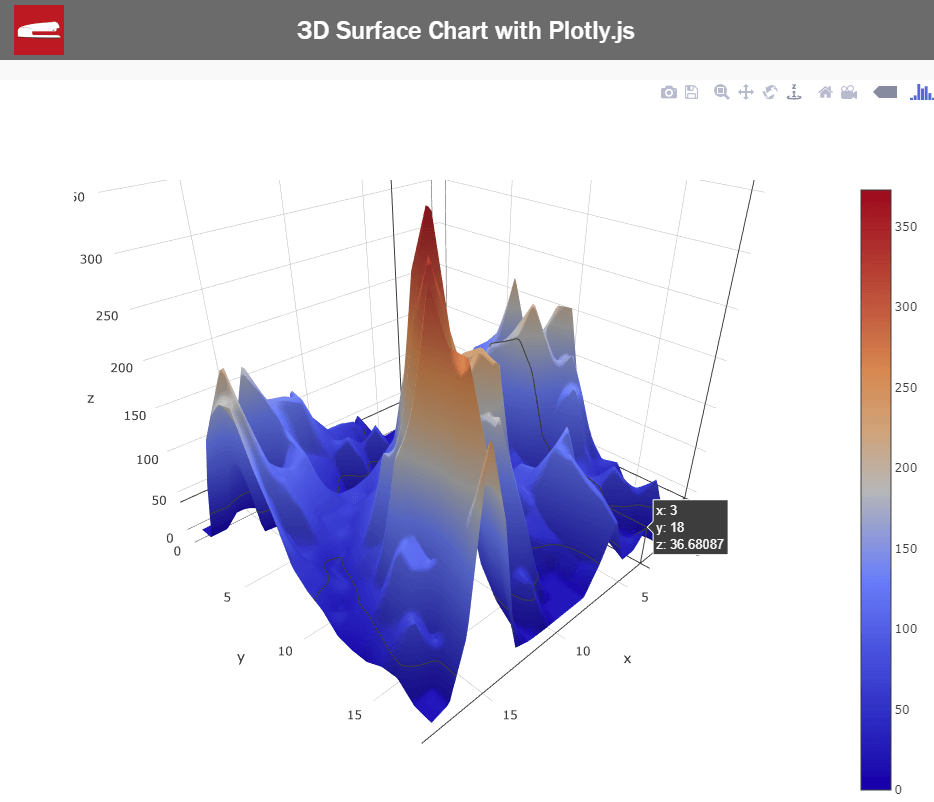
}]);That’s it. Here is the result.
Read Chart Data from CSV file
In real-life scenario, we wouldn’t use the random value like this. With Plotly, you can read the CSV file to retrieve the data by using Plotly.d3.csv function.You can pass the URL or path to your CSV file. follow by a callback function when the CSV was loaded.
Plotly.d3.csv('data_file.csv', function(err,rows) {
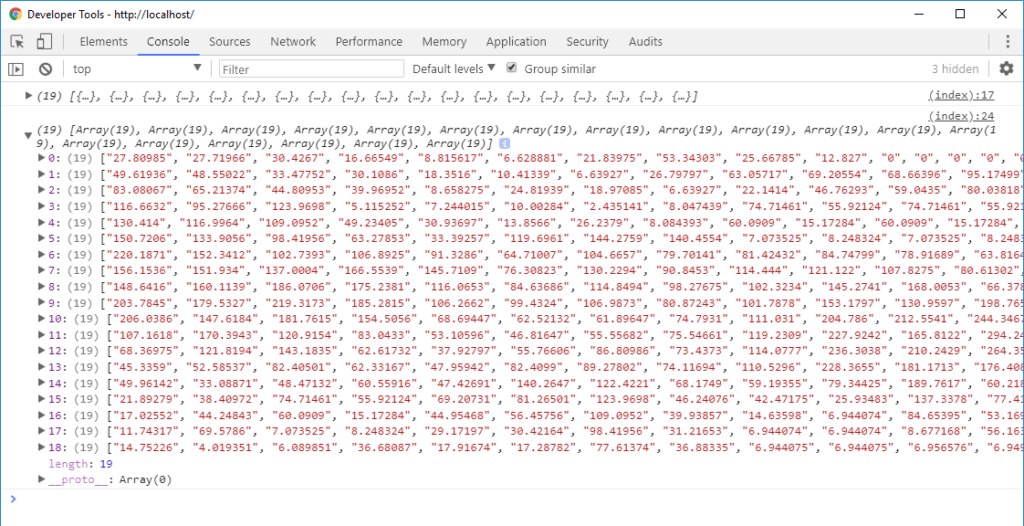
console.log(rows); // data from csv file
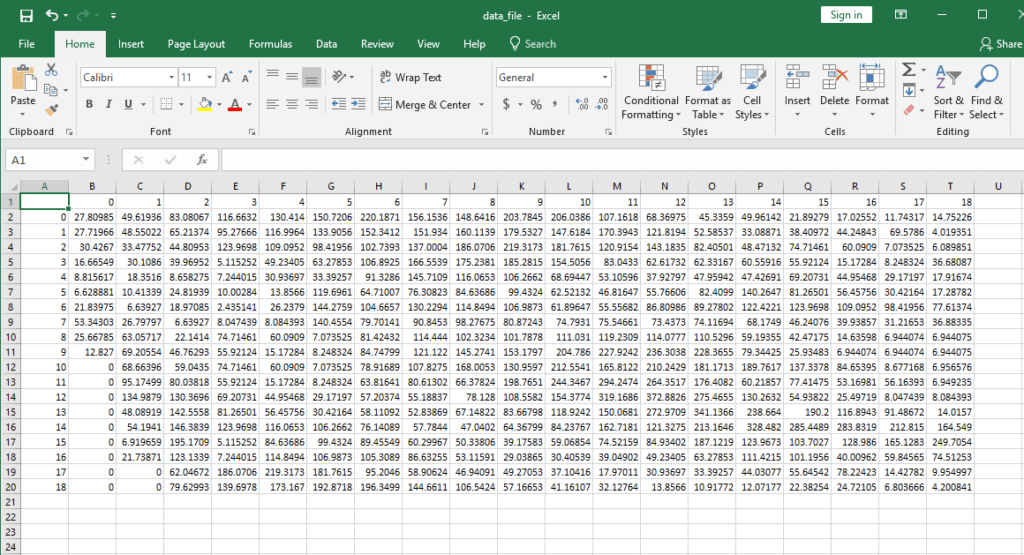
});The first parameter is the error (if there is any). And the second one is the rows object from the CSV file. The CSV data need to be in this format with the first row and column having x and y values
Here is the returned value from CSV file if we display it on console.
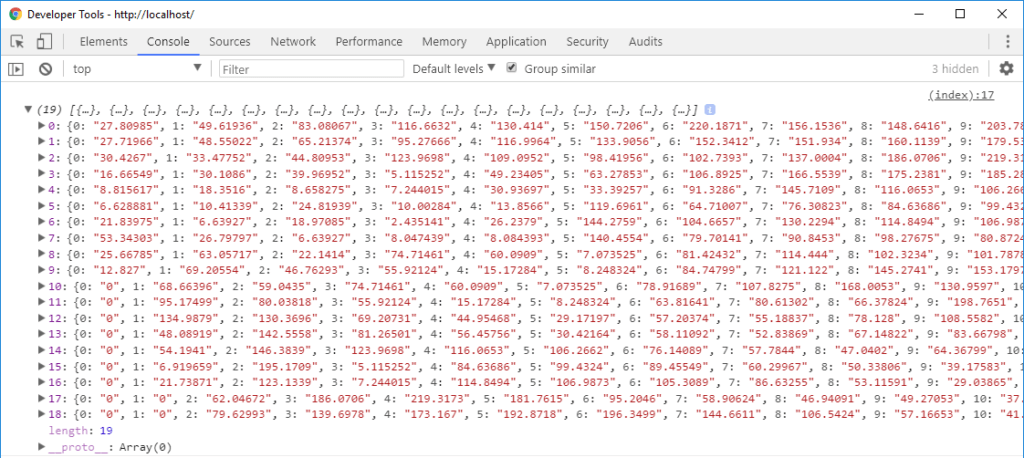
You’ll see we now have the value of each row but it’s in object format. We need to convert it to array before we can pass it to Plotly. You can do that easily by using map method.
var data = [];
for(let i=0;i<rows.length;i++)
        data.push(rows.map(row => row [i]));
Now we have the data in the correct format. The final step is to create the chart.
Plotly.newPlot('chart',[{
       z: data,
       type: 'surface'
}]);
Or see it in action in this video
This is only the basic and there are lots of options to customize your chart. you can visit Plotly documentation and try experiment it. If you like this tutorial, feel free to subscribe to our Youtube Channel and stay update with more interesting JavaScript library and tutorials.
Source Code
Example 1
<html>
    <head>
    <meta http-equiv="content-type" content="text/html; charset=UTF-8" />
    <script src="plotly.min.js"></script>
    </head>
    <body>
    <div class="wrapper">
        <div id="chart"></div>
        <script>
            function getData() {
                var arr = [];
                for(let i=0;i<10;i++)
                    arr.push(Array(10).fill().map(() => Math.random()))
                return arr;
            }
            var data = getData();
            console.log(data);

            Plotly.newPlot('chart', [{
                   z: data,
                   type: 'surface'
            }]);
        </script>
    </div>
    </body>
</html>
Example 2
<html>
    <head>
    <meta http-equiv="content-type" content="text/html; charset=UTF-8" />
    <script src="plotly.min.js"></script>
    </head>
    <body>
    <div class="wrapper">
        <div id="chart"></div>
        <script>
            Plotly.d3.csv('data_file.csv', function(err,rows) {

                console.log(rows);
                var data = [];
                for(let i=0;i<rows.length;i++) {
                    data.push(rows.map(row => row [i]));
                }
                console.log(data);
                Plotly.newPlot('chart',[{
                z: data,
                type: 'surface'
            }]);

            });
        </script>
    </div>
    </body>
</html>
I love ur videos..
Very much interesting nd good videos..
How do you hide the Plotly toolbar?