Create JavaScript Real-Time Chart with Plotly.js
In this tutorial, I’m going to show you how to create a real-time line chart with JavaScript using Plotly.js. Plotly.js is a charting library that was built on top of d3.js and stack.gl. Very useful for displaying various chart types with great performance and also support 3D charts using WebGL.
Setup
If you’re not using npm, download the latest version from github and include it to your page using script tag. Make sure you use minified version since Plotly.js file size is quite large (6MB full vs 2MB minified)
<script src="plotly.min.js"></script>
Create a div element for the chart.
<div id="chart"></div>
Now we’ll need to retrieve the data point to stream the real-time chart. This can be in form of AJAX call to the REST API endpoint, 3rd party data provider or the result from the calculation on your own website. Anyway, for the simplicity, we will use a random value for this tutorial.
function getData() {
return Math.random();
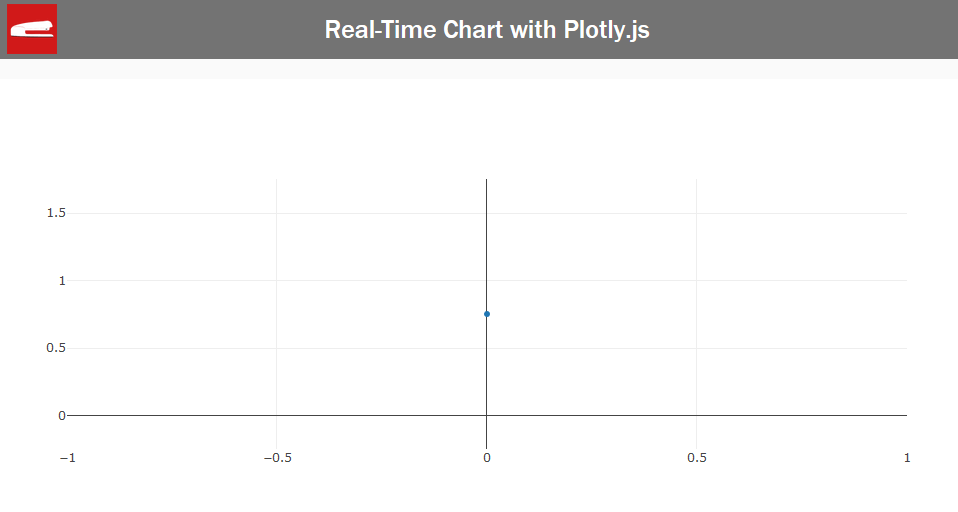
}Next we will create a line chart using Plotly.plot and pass the element ID as first parameter and follow by the graph definition object. Inside, I’m going pass an array and call getData function to retrieve the first data point for our chart. Also set the chart type to line.
 Plotly.plot('chart',[{
        y:[getData()],
        type:'line'
}]);
If you run the code now, you will have a chart with our first data point.
Automatically Update the Chart
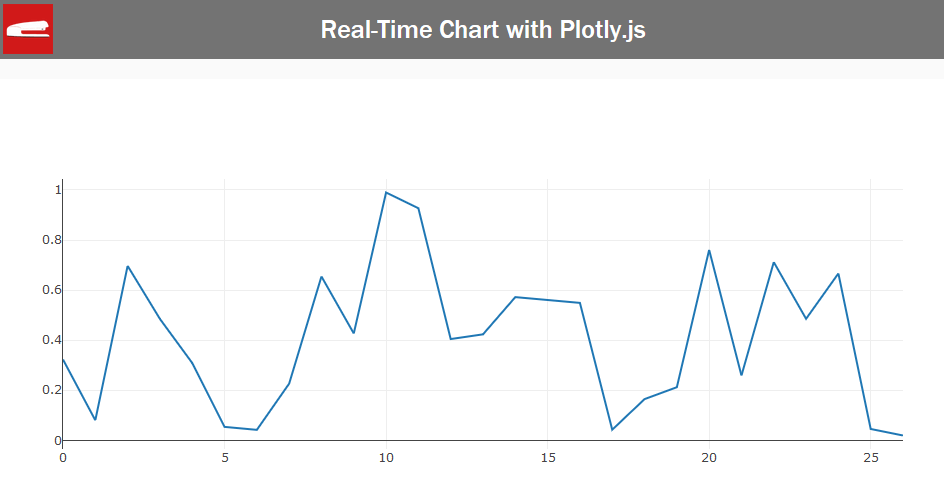
Next, we will add the code to automatically retrieve the next data point and update chart.
I’m going to use setInterval for every 200 milliseconds. This will be your chart updating frequency and you can change the interval time as you like.
setInterval(function() {

   // code for chart update logic here

}, 200);
Now inside, we’ll call Plotly. extendTraces. this is the basic function to extend the current chart with a new set of datapoints. We’ll pass the chart element ID, follow by the data object. You’ll notice that I use 2D array because Plotly supports multiple traces in a single chart. So you can provide multiple data array for each trace with a single call of this function. And the final parm is the array of index of chart traces that you want to extend with the data provided. Since we only have one trace, we’ll use zero.
setInterval(function() {
  Plotly.extendTraces('graph', { y: [[getData()]] }, [0])
}, 200);
So let’s see how it works!
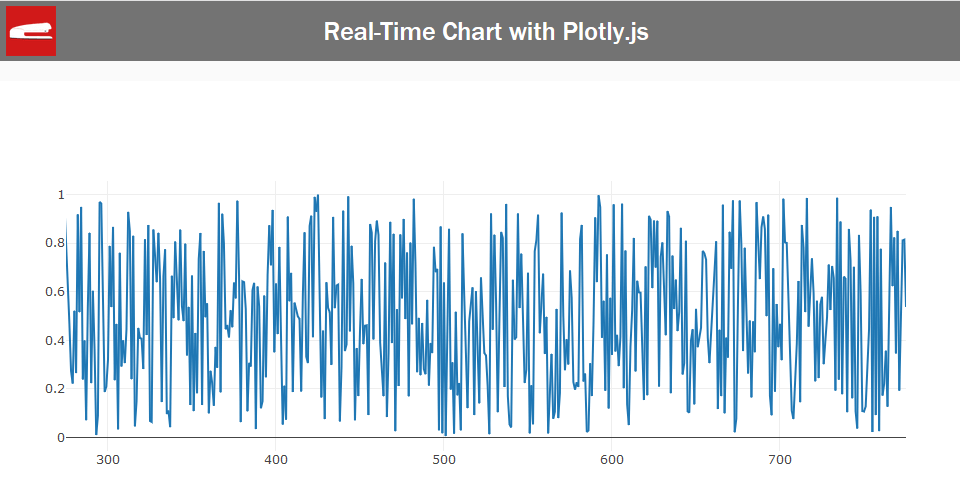
Dynamic “Sliding” Chart Range
Now if you want the chart to slide along with the new data, we can use relayout function to update the x-axis range.
First create a counter and increment it for each time the new data point is appended. Let’s say if you want to display 500 data points before we begin to ‘slide’ the chart.
var cnt = 0;

setInterval(function(){
   Plotly.extendTraces('chart',{ y:[[getData()]]}, [0]);
   cnt++;

   if(cnt > 500) {
      // code for chart 'sliding' here
   }

},15);
We’ll pass our chart element ID as usual. And next, we’ll redefine the x-axis range. we’ll set the starting value to the current count minus by 500, and use the current count as ending range.
if(cnt > 500) {
   Plotly.relayout('chart',{
        xaxis: {
                  range: [cnt-500,cnt]
               }
   });
}
And that’s it. Let’s see the result in the video below.
So, that’s all for this tutorial. Please find the full source code below. Also please follow us on our Facebook and Youtube Channel to stay tune if you love this tutorial 🙂
Source Code
<html>
    <head>
    <meta http-equiv="content-type" content="text/html; charset=UTF-8" />
    <script src="plotly.min.js"></script>
    <link rel="stylesheet" type="text/css" href="styles.css">
    </head>
    <body>
    <div class="navbar"><span>Real-Time Chart with Plotly.js</span></div>
    <div class="wrapper">

        <div id="chart"></div>
        <script>
            function getData() {
                return Math.random();
            }

            Plotly.plot('chart',[{
                y:[getData()],
                type:'line'
            }]);

            var cnt = 0;

            setInterval(function(){

                Plotly.extendTraces('chart',{ y:[[getData()]]}, [0]);
                cnt++;
                if(cnt > 500) {
                    Plotly.relayout('chart',{
                        xaxis: {
                            range: [cnt-500,cnt]
                        }
                    });
                }
            },15);
        </script>
    </div>
    </body>
</html>
Simple and working perfectly!
Please can we change ‘graph’ to ‘chart’ for consistency in
setInterval(function() {
Plotly.extendTraces(‘graph’, { y: [[getData()]] }, [0])
}, 200);
Sorry, I’m trying to insert 2 more tracks, but I can not make it work, can you tell me how to do it?
Hello, I am Using Same Code in the MIT App Inventor 2 to display Real-Time Data, But Not Sure where the screenshots getting saved.
please work out a solution if we want to change the appearance of the x-axis and the y-axis. for example on the x-axis I want to display danger, non-hazardous writing, and on the y-axis I want to display the current time
Sir, how can I input data from the database to the grapich? I am waiting for it, can I reply to my comments or upload YouTube videos?
Thanks for providing great information. I am writing a standalone chromebook app in which I need to display real-time charts of physics data. I loved your example and would like to use plotly, but when I try to include plotly.min.js with my other scripts I get the error: “Uncaught EvalError: Refused to evaluate a string as JavaScript because ‘unsafe-eval’ is not an allowed source of script in the following Content Security Policy directive: “script-src ‘self’ blob: filesystem: ‘wasm-eval'”. When I google this I see that others have had the same issue and some suggest some ways to mitigate this in chrome extensions, but not for a standalone chromebook app.
Do you have any suggestions for how to get around this? Sorry if this is a naive question – I am rather new to JavaScript though I have been programming in C#, C++ & Python etc for many years.