
How to Monitor Memory Usage of Google Cloud VM
If you host your website on an unmanaged host like Google Cloud or AWS, monitoring server resources like CPU and RAM is very important. If you keep available resources only at marginal level, you might have a problem when facing a traffic surge. In this tutorial, we’ll show you how to monitor memory usage on your Google Cloud VM Instance using Stackdriver Monitoring Agent.
Stackdriver Monitoring Agent
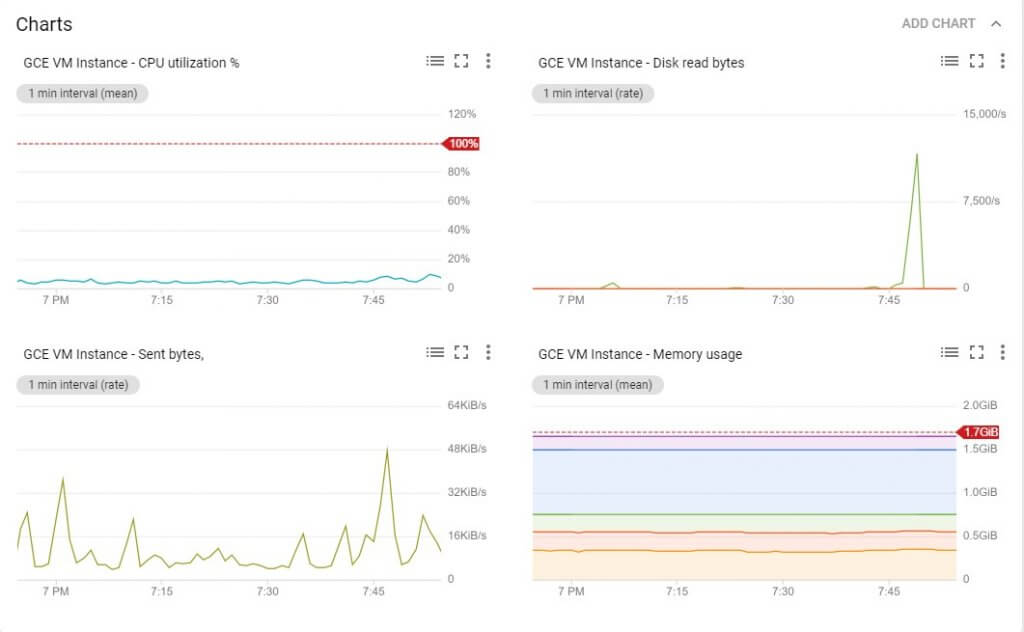
For CPU Usage we can monitor it directly from Google Cloud console with data provided via hypervisor. However, viewing RAM Usage is quite different and require you to install a monitoring agent to your server.
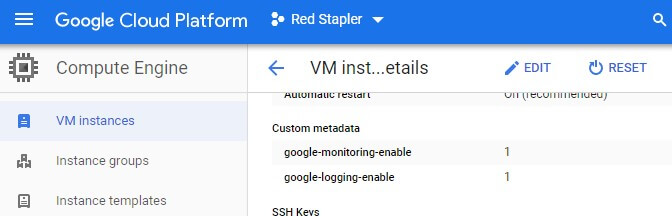
But before you can install a monitoring agent, first you must enable google-monitoring-enable and google-logging-enable metadata on your VM instance to allow the agent to collect the data. You can edit this via instance detail in Google Cloud console.
Then to install the agent, Google already provided a script for you.
curl -sSO https://dl.google.com/cloudagents/install-monitoring-agent.sh
sudo bash install-monitoring-agent.sh
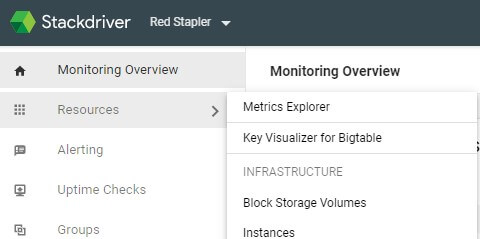
After that wait for a moment for the agent to collect the data. Then you can open Stackdriver dashboard.
Metric Explorer
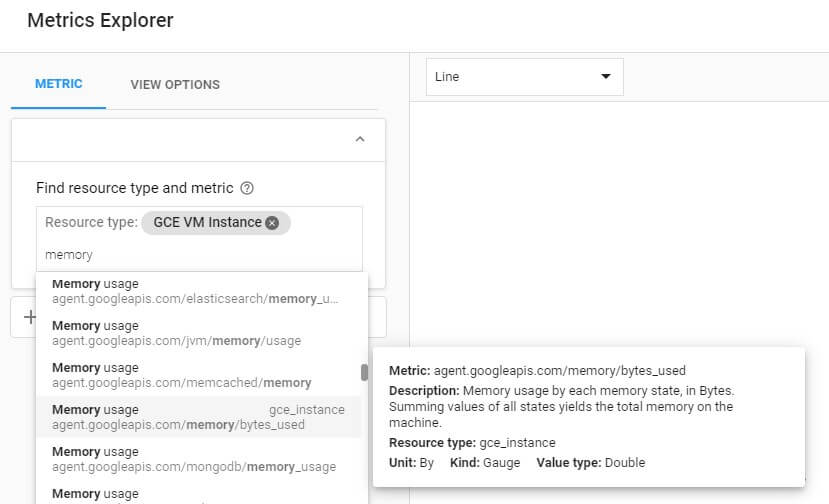
To view memory usage statistic, goto Metrics Explorer
Then select GCE VM Instance Resource Type and select Memory Usage (agent.googlapis.com/memory/bytes_used)
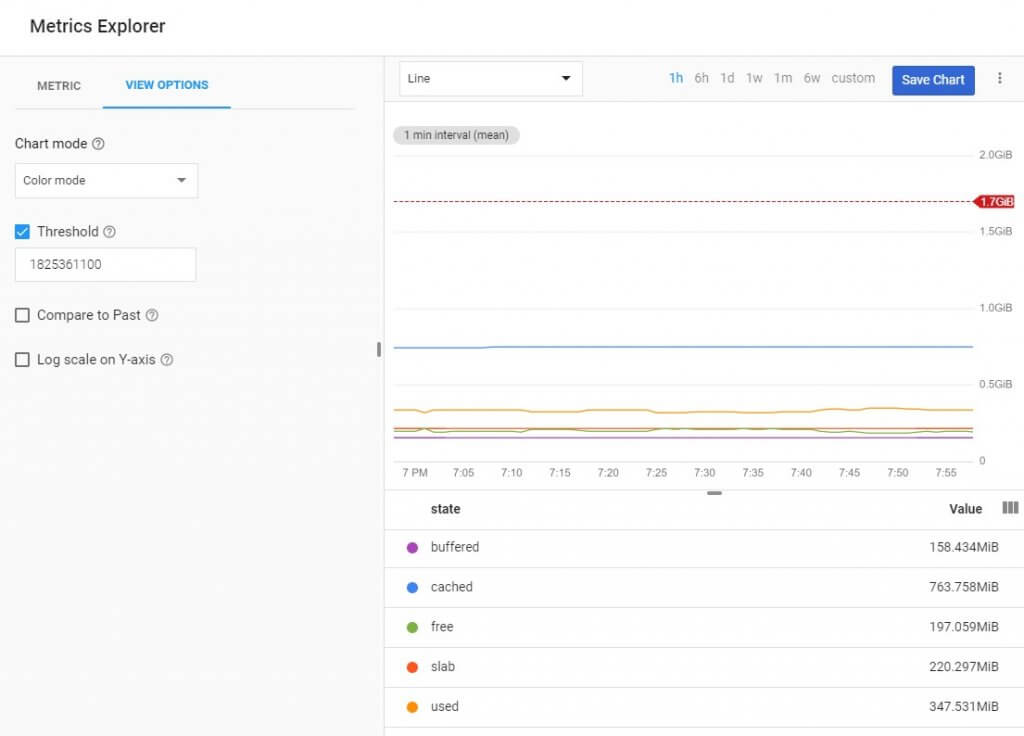
Then in view option, you can setup a threshold. I usually set it to the current total memory. This will have to be in byte unit.
Now you can add more metrics to the Dashboard and monitor your server resources like a pro!
Few Notes
Since we installed an agent to collect the data on your server, it will cost some of your resources. So if you’re using the smallest instance like f1-micro, you’ll see a noticeable increase in CPU and RAM usage.
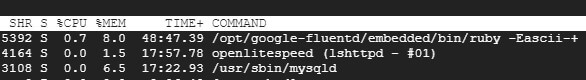
You can disable fluentd process if you don’t use stackdriver logging features to free some of the resources. Here is the stats before and after I disabled fluentd on f1-micro instance.
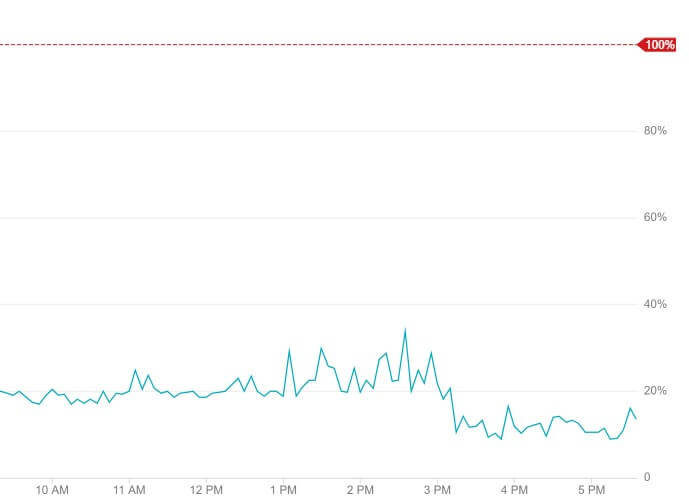
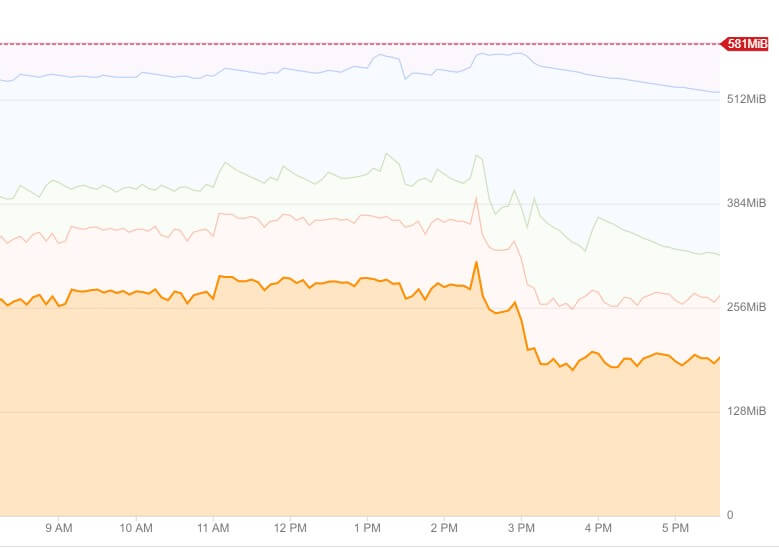
So that’s around 10% CPU and around 150MB RAM free from fluentd. A significant amount for a micro instance.

please make some videos on responsive design.